At EKM one of the longest running most requested features was some sort of analytics product to give customers insight into their orders. It’s a feature we had discussed extensively in the Shop Management Squad (my agile squad) because it’s a feature we were truly excited to work on and a feature we knew customers would love.
In late 2017 we were told our next priority was to start work on the new feature we were simply calling “Analytics”. We were due to release something early 2018.
High-level requirements
We knew this feature was to be built around customer requirements and the data we actually had access to.
- Analytics was to be a top level feature – meaning it would become a tab within the EKM interface header.
- The feature would initially be released as a beta product to allow constant iteration.
- The business required this feature to be locked to certain plans as an upgrade incentive.
- Release an MVP with at least one report in Jan 2018.
- We must collect customer feedback, and iterate the product based on this.
User personas
Luckily EKM used user personas in work across a lot of departments so we knew the types of users we were building this product for, the types of difficulties these users typically experience and what their business goals are.
I’ve included 3 user personas below from memory since, at the time of writing, no longer have access to the actual personas. I believe we operated based on around 5 personas.
#1 The brick & mortar shop owner, now selling online
Who they are
- They started out selling in a fixed physical location
- They moved to selling online after they established their business
- They are typically between 40-60 years of age, typically male
- Selling offline is still their primary focus
- They are not very tech savvy
What they want
- They want selling online to be effortless and turn-key
- They want to be able to manage their retail stock and online stock together
- They want to still focus their marketing efforts in old formats (print, in-store promotions, etc)
What they don’t want
- They don’t want to spend time constantly tweaking their online store.
- They don’t want or have time to focus on digital marketing.
- They don’t want to spend money on online advertising.
#2 – The stay at home parent selling online
Who they are
- They are a stay-at-home mum/dad.
- They are self-employed sole traders
- They run their business during school runs and out of business hours.
- They focus less on their business during half-term and summer holidays.
- Selling online is their primary presence.
- They are tech savvy and willing to learn
- They are typically between 25-35, typically female
What they want
- They want setting up their shop to be simple.
- They want to spend more of their time processing orders, less time managing the shop.
- They want to be able to deactivate or suspend their business at short-notice.
- They want to easily be able to monitor and visual their successes and failures.
What they don’t want
- They don’t want to run big ad campaigns (due to a small budget).
- They don’t want too many orders to process or spikes in orders.
#3 – The side hustler
Who they are
- They are a full-time employee selling online in their spare time.
- They are both self-employed and full-time employed.
- They run their business out of hours.
- They are tech-savvy and willing to learn
- They are typically between 20-30, typically male
- They have some disposable income to invest
What they want
- They want setup to be simple
- They want access to support outside normal business hours
- They want quick success
- They want to react quickly to successes and failures
- They want to invest in some online marketing
What they don’t want
- They don’t want to be tied into contracts
- They don’t want high business costs
These user profiles are useful to us during the planning/design process because whenever we have an idea or make an assumption, we can test it against our ideal customer’s goals.
Idealistic analytics package
Whenever my team work on a new product or feature as an exercise we like to start at the end and try to imagine what the final product may be like.
This process isn’t designed as a way to jump the gun, make too many assumptions and then ultimately design a product customers don’t want. It’s designed as a way for us to roughly plan our route, consider potential future features early on and make the right choices.
We knew from the requirements that we expecting to release an MVP which may only feature a few reports at most.
From a design and usability perspective if you design around only the MVP and don’t even consider how things may develop as the product grows, you ultimately have to make bigger design changes which impact usability and frustrate customers.
So, we discussed various ideas for Analytics reports based on competitor research done by our research department (2 years prior) and then started to play around with a rough prototype of what that dashboard may look like.
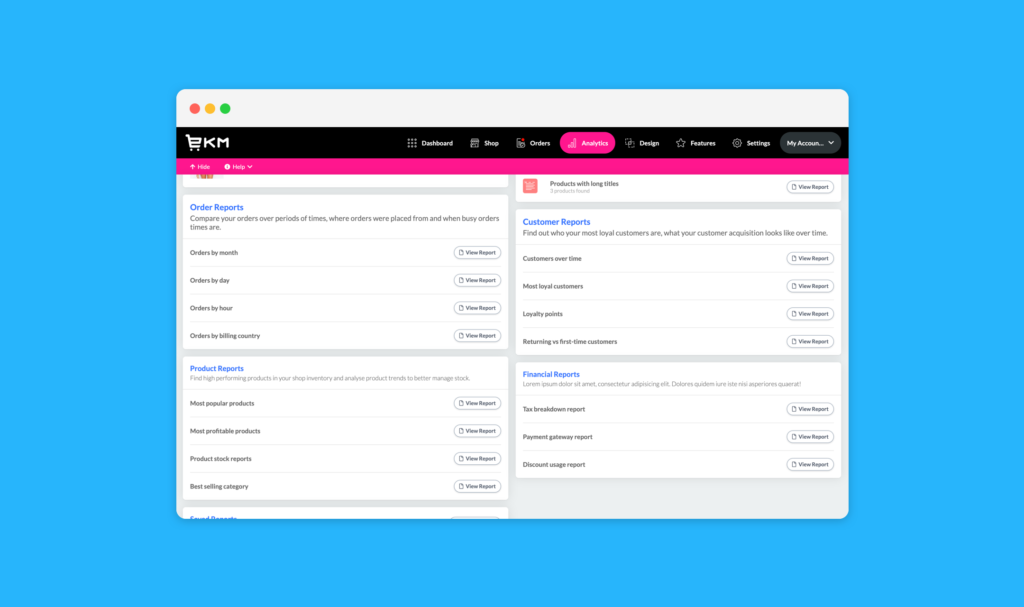
Based on the 2-year old competitor research and a few of our own ideas we built out how the entire Analytics feature would look at the end.
We included:
- Number of orders (by hour, day, month, year, country)
- Number of customers (new vs returning, most loyal customers, loyalty points)
- Products (Most popular, best selling category, most profitable product, low stock, out of stock)
- Content analysis reports (products with poor images, descriptions, etc)
- Financial reports (Tax breakdown, VAT paid, popular payment processors, discounts)
- Saved custom reports
The point in this exercise is never to build the end result, it’s to picture how a full-featured product would look and build early designs around a path to that.
Again, we don’t want navigation to work one way early on, and then be completely changed in phase 2, then again in phase 3.
Ultimately the final product will be based on customer feedback.
Minimum viable product
The MVP had to be designed and built around the 2 year old research we had and more recent customer requests.
Quick history lesson: EKM has a section called customers and orders where shop owners can find their shop orders and details about customers. Around 2013 EKM rebuilt this section and retired the legacy version. Due to customer outcry (reasons below) the legacy version was still made accessible after the upgrade, and was never fully retired.
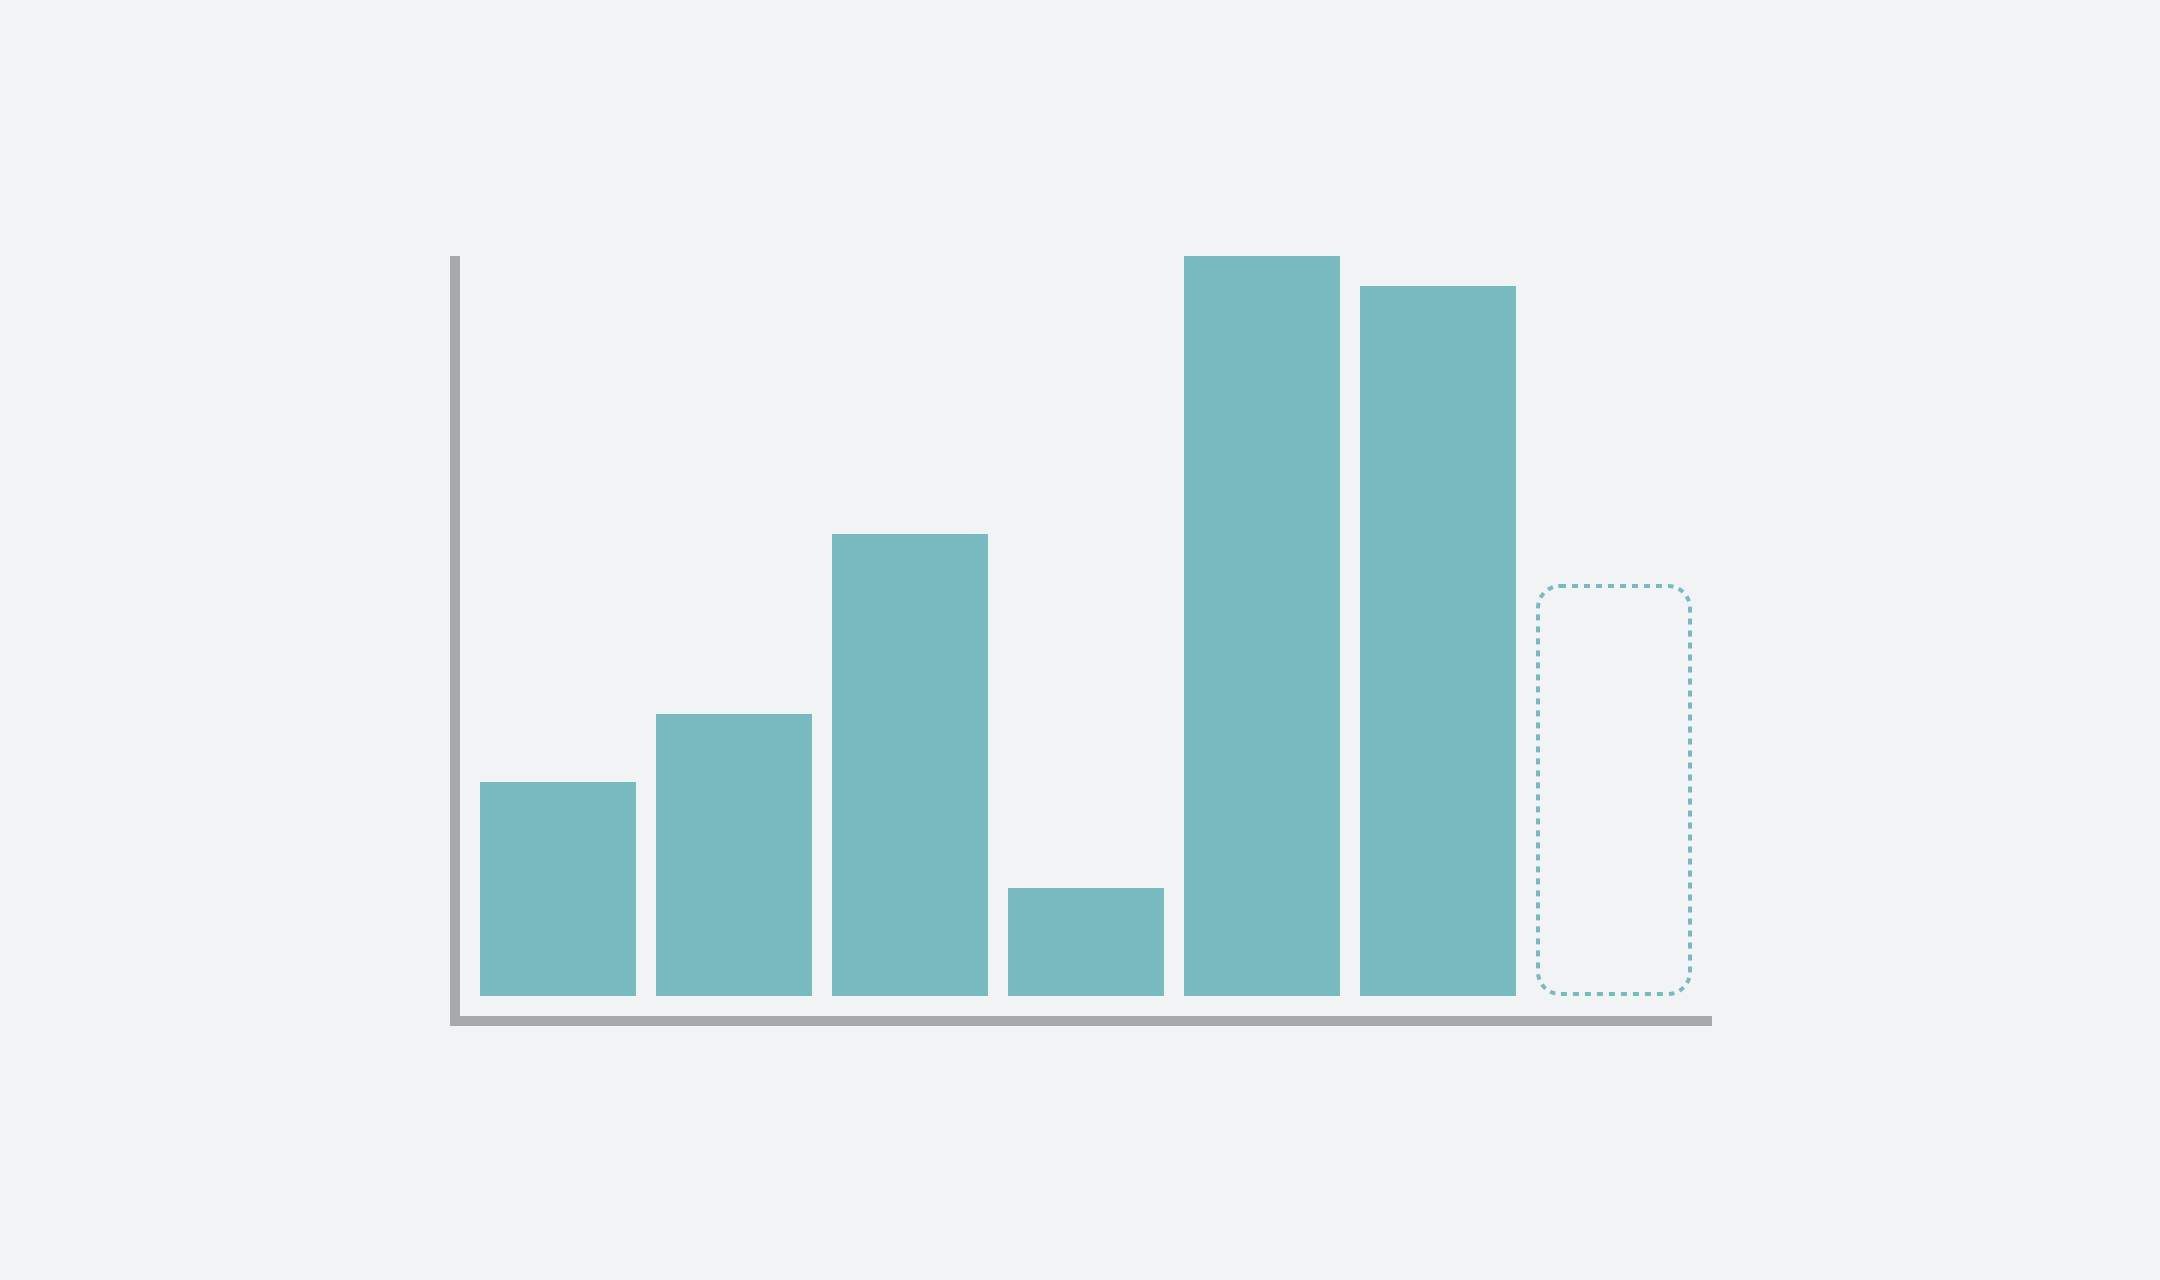
During early discussions with my team we discovered a lot of customers were still using the legacy version of the customers and orders section because of a very basic feature that the new, 2013, version didn’t have – graphs showing the total number of orders for each month for a 12 month period.
Customers were still asking for this graph to be added to the new customers and orders section because it was valuable information for them when monitor their shop success. Each time the legacy version was on the brink of being fully retired, enough customers complained that it’s life was prolonged a little more.
We knew this was the perfect first report and possible MVP because:
- Customers had/have it and use it
- Customers request a new version frequently
- Customers need this information to monitor their success
- Replacing it would allow for the legacy version to be retired for good (so another team benefits from it)
So this is the MVP we set out to build in late 2017.
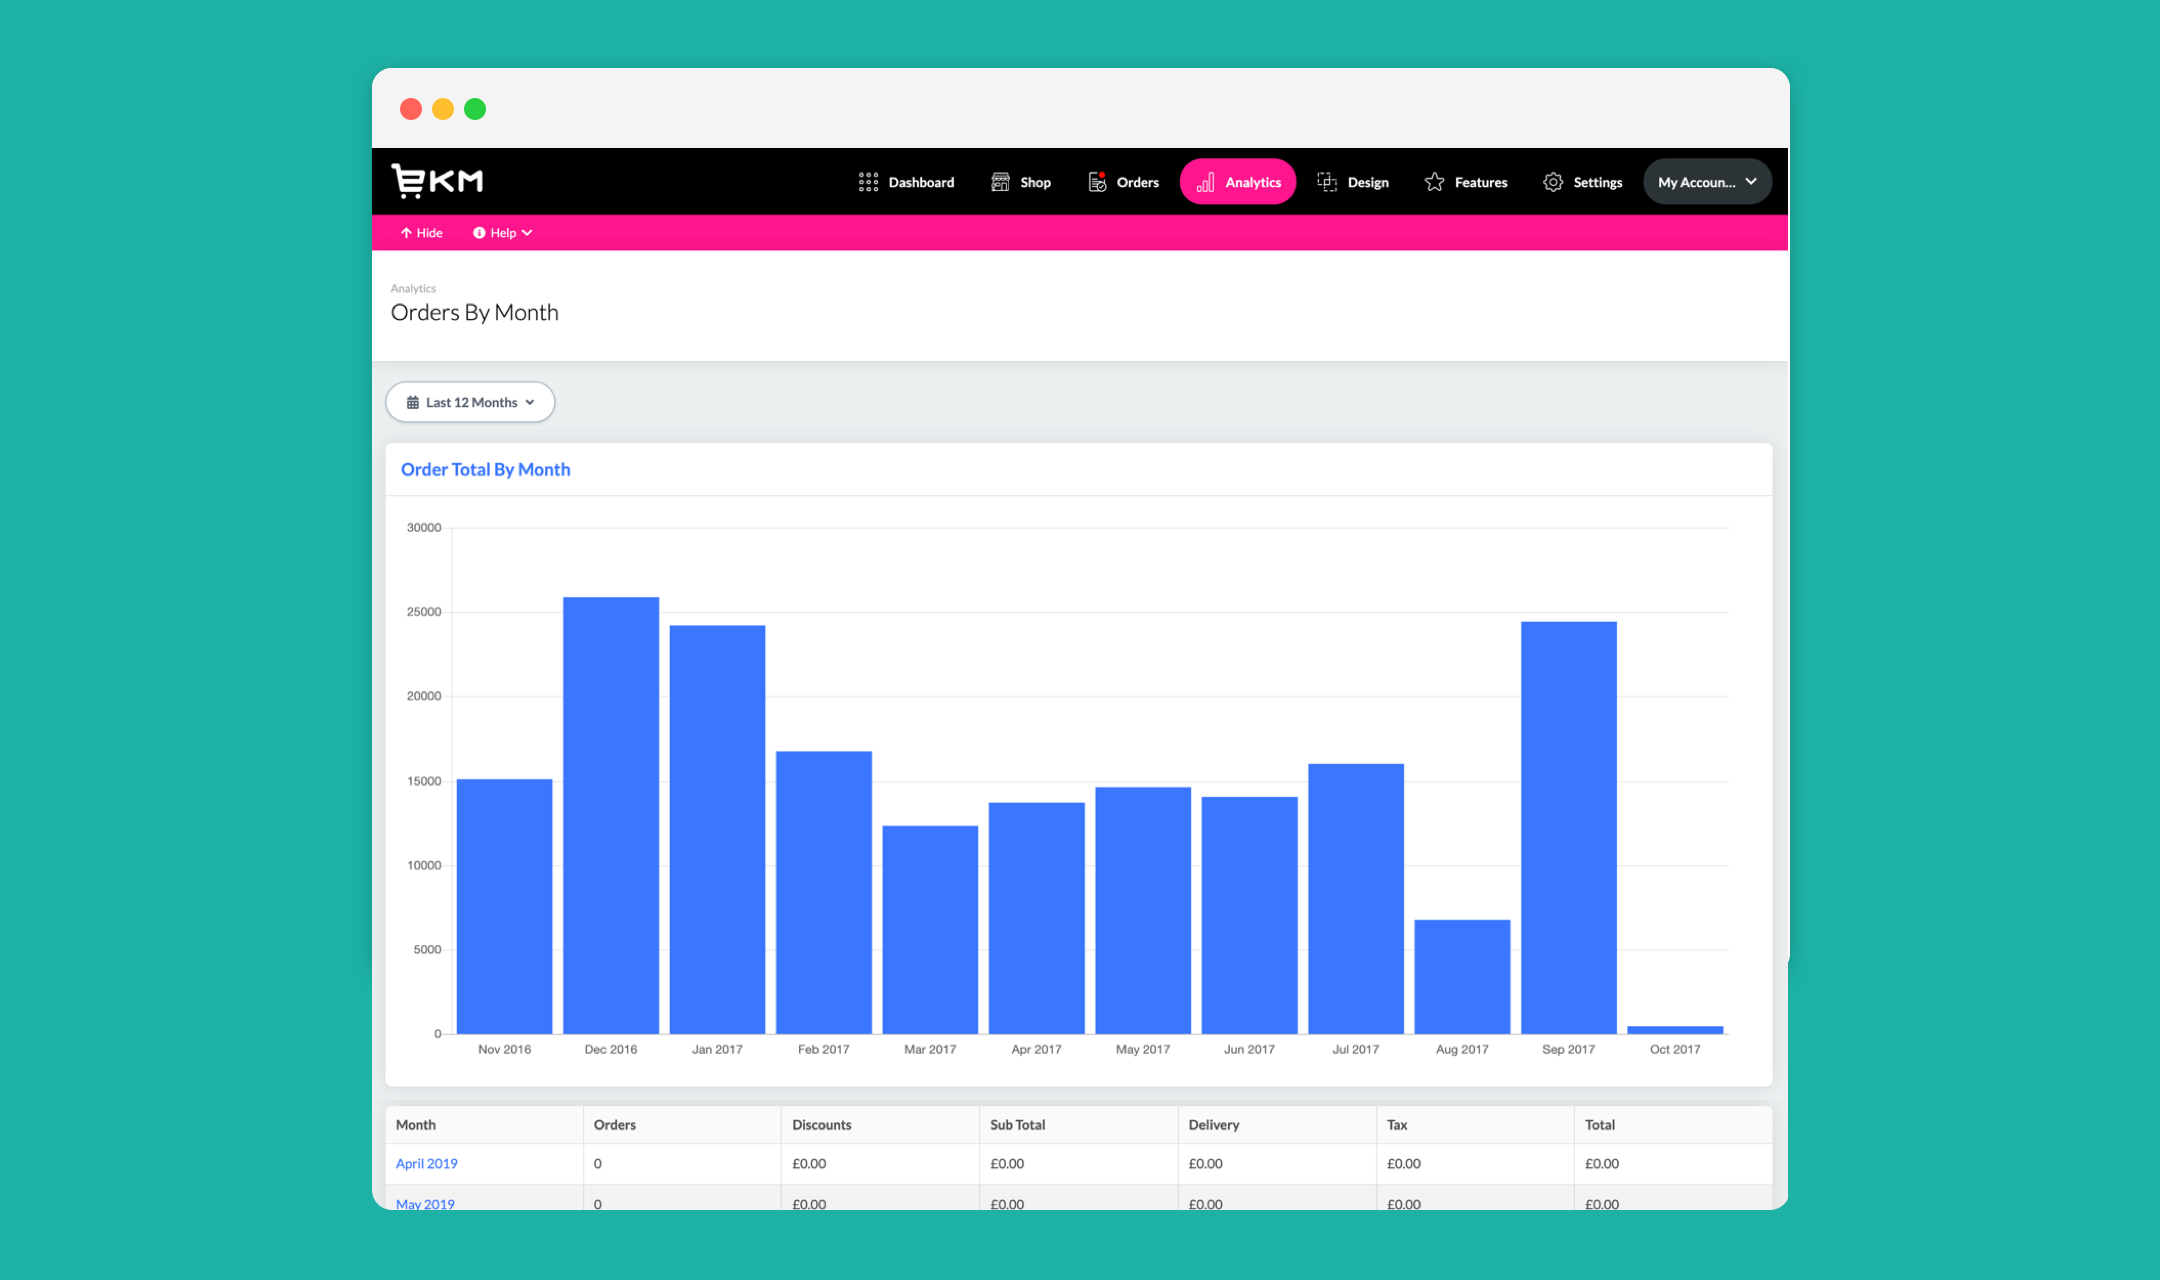
The MVP would feature the following:
- A single report with the number of orders for each month
- A graph representation of the data
- A data table with: Number of orders, discount amount, sub-total, delivery cost, tax taken and total.
- The ability to change the reporting period (default last 12 months)
- A way to collect user feedback
We wanted the MVP to be valuable to everyone so we used our user personas as a way of determining how impactful the MVP would be for those users.
- Easy to visualise your shop’s success (✅ persona #1, #2 and #3)
- Low entry point and minimal learning curve (✅ persona #1, #2 and #3)
- Additional cost for some data (✅ persona #3) (☹️ persona #1 & #2)
Again these personas are from memory so I can only address some of the points.
Prototyping
EKM is built on a HTML and CSS design system called the UIFW (User Interface Framework) which is a project I created before even becoming a UI designer at EKM – it is designed to aid development and create consistency throughout the product.
To improve my workflow when working on quick-to-iterate projects I typically move from a mental or hand-sketched idea straight into building a static HTML and CSS prototype using the UIFW.
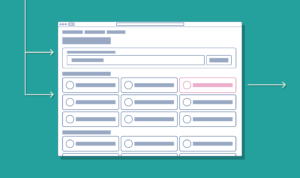
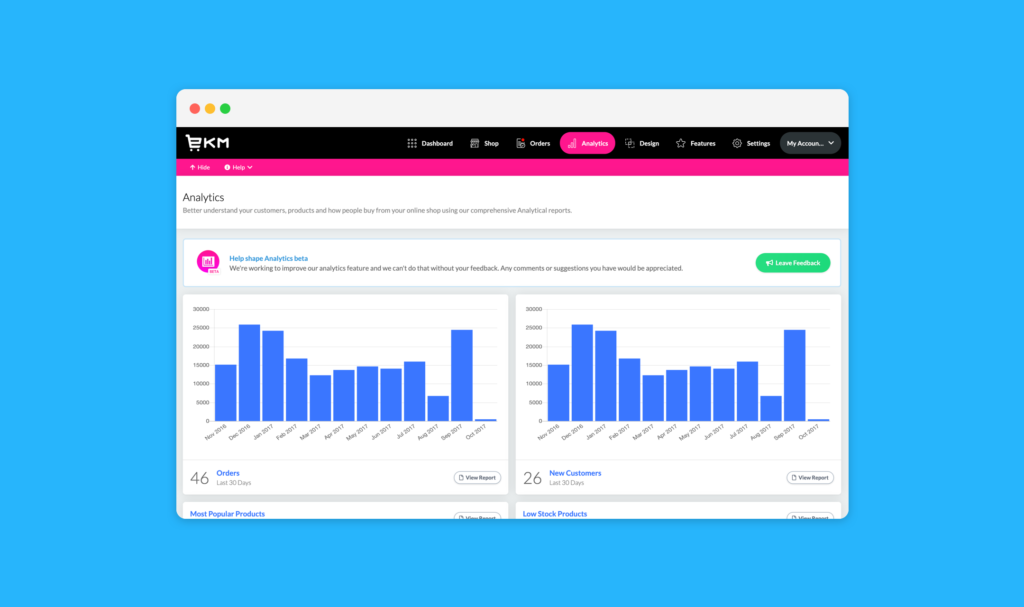
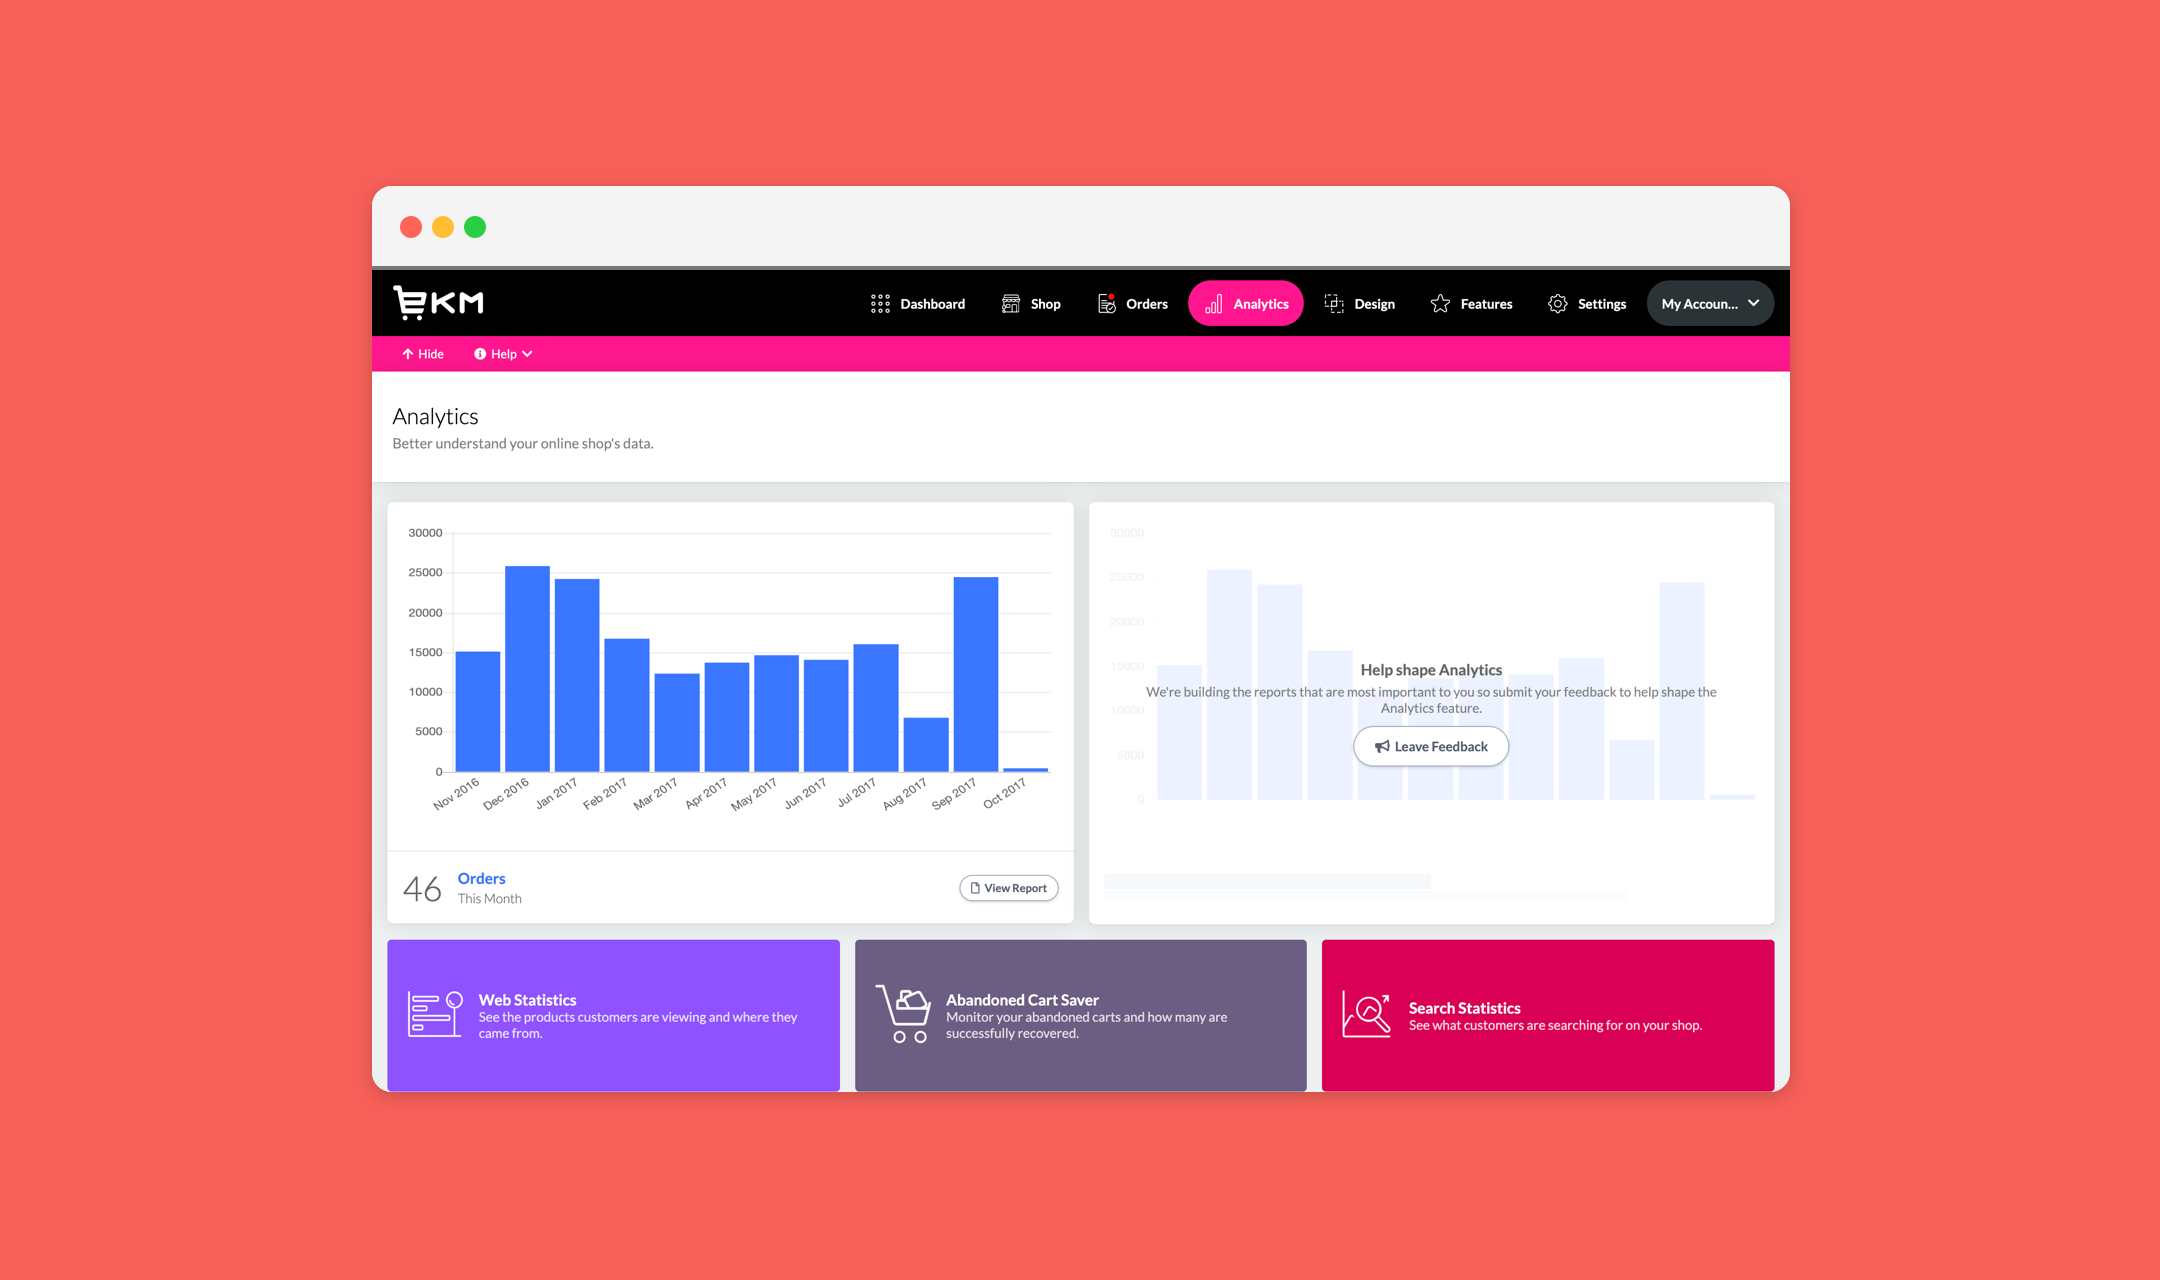
The Analytics tab initially became a single report, since there was no need for a dashboard for one report.
It had a large bar chart for the last 12 months which represented the number of orders.
We included a data table which had broken down information about orders for each of those months (delivery costs, sub-total, tax, etc).
Finally in the footer of the page we included a way to collect user feedback to guide our next iterations of the product.
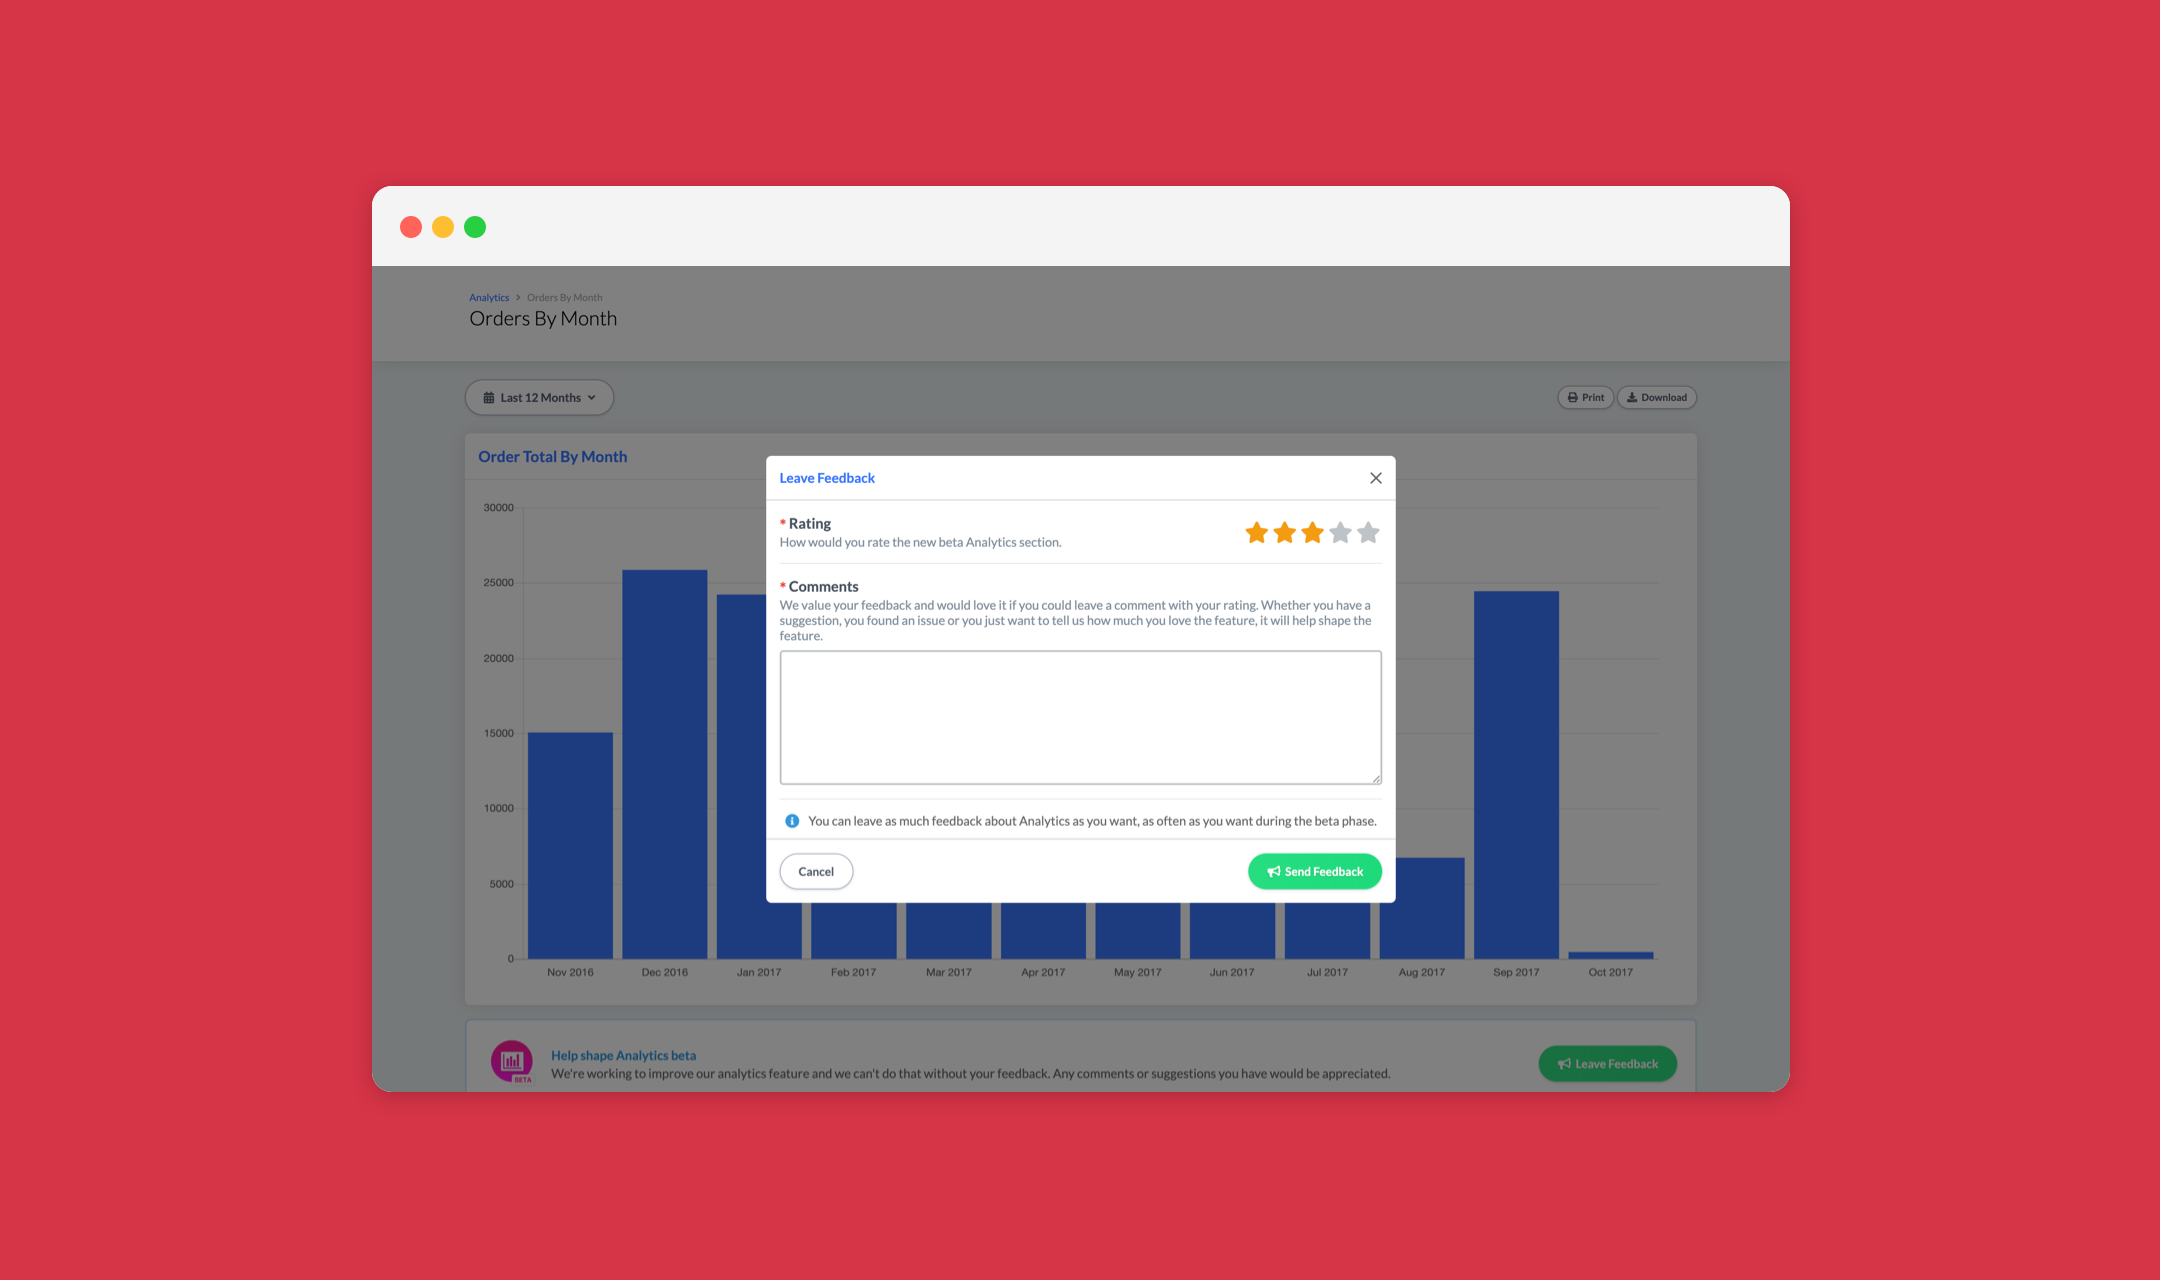
Initially the feedback we wanted to gather was very open ended because we wanted to know people’s opinions on the first report as well as any suggestions for future reports.
Release
We released the MVP of Analytics just before the end of the working year in 2017 – earlier than expected – and allowed Analytics to gather feedback over one of the busiest periods.
Internally because Analytics was just a single report (often referred to as Analytic) the EKM marketing team didn’t want to push the feature release in newsletter so the feature was left to be naturally discovered over Christmas.
Phase 2
Because of the way our sprints worked we would release the previous sprint as part of the next sprint. So for the Phase 2 sprint we didn’t have any feedback (since it hadn’t been released) so we spent this 2 week sprint adding in additional features based on early competitor research.
In Phase 2 we added:
- Ability to download report data as CSV
- Ability to print reports (this was just a print stylesheet)
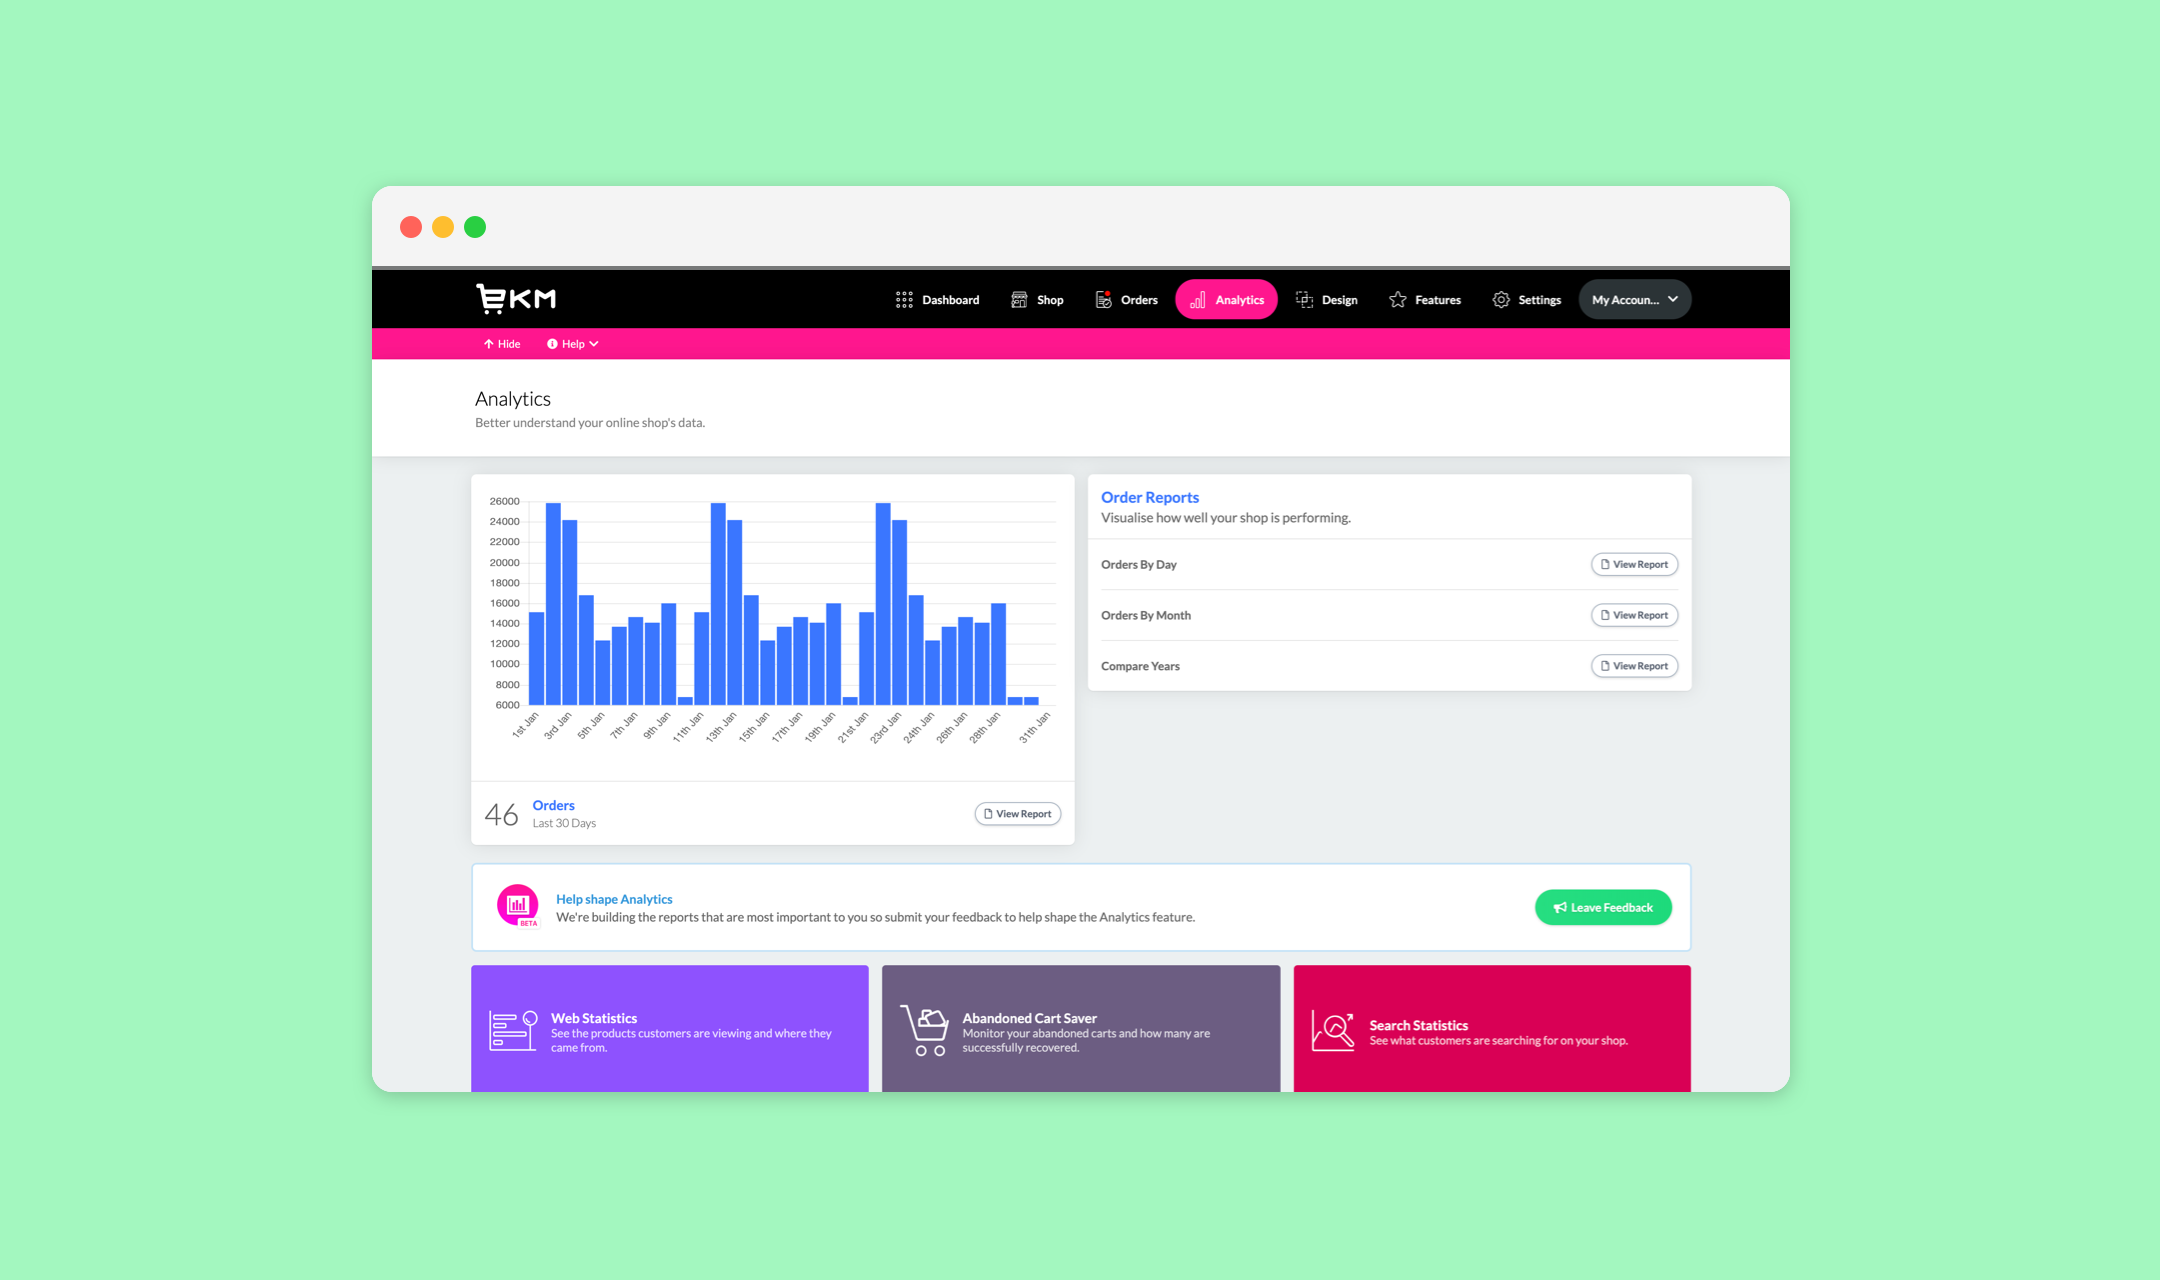
- Analytics root view (dashboard)
- Closed question user feedback form (added mid-sprint)
- Links to other Statistics features in the system (features built before analytics section)
User Feedback
Instead of asking the open-ended question “What do you think?” we instead asked users “What is the most important report you want to see next?”.
The reason for this shift in feedback gathering is because we found customers we using the feedback form to report bugs elsewhere in the system and we were finding it difficult to parse the information.
Phase 3
This was the phase where we were starting to action feedback from the MVP release (due to the way sprints were released).
The feedback we were getting from users was surprising because customers were not asking for entirely new reports, they were asking for variations of the same reports.
Our expectation was that customers would want big flashy reports and insights and even our MD asked in the Sprint Review presentation he attended when we were going to start adding the “marketable reports with flashy world maps and heat maps”. Ultimately we found users were not asking for this.
Users were asking for:
- Orders by day: Users wanted to see a breakdown of order numbers and values by day.
- Compare years: Users wanted a variation of our first report, but comparing one twelve month report to the last 12 month report.
- Best and worst selling products: Which products on their shop were performing well, and those that were not.
Phase 3 was when we started working on implementing these new reports as well as making the usability of the first report better.
How we handled user feedback
All user feedback collected through our in-app feedback form was fed into a Google Sheets documented which was accessible to anyone internally for transparency. We collected the response and username (so we could follow up with these customers).
This system for collecting feedback worked very well because it allowed us to get unedited feedback straight from the user.
Internally we were actively discouraging our customer care teams from submitting feedback on behalf of customers and instead asked them to get the customer to do it. The reason we did this was to reduce EKM-staff interpretation of the customer’s feedback.
During the feedback process I liaised directly with customers if clarification was needed and the customer satisfaction for the Analytics feature was high because these customers were seeing their feedback actioned – within weeks.
Any request for a report we received we added a new Trello card to our squad project board and ordered these cards by the number of requests. The report with the most votes was the report we built next.
Phase 4
We had around 30 requests for reports with the majority, at phase 4 stage, having only a small number of votes. It was at this point that the business requirements had changed and we were to shift our focus on the company USP – Evolution mode.
The idea behind evolution mode was that your shop was ever evolving to make you more sales. A evolution mode team of junior web designers were tasked with changing customer themes, updating product pages and doing general conversion rate optimisation.
We were asked how we could help and came up with a few ideas for Analytics that would allow shop owners, and EKM staff, to improve their shops and products themselves. We called this feature-set – Shop Health.
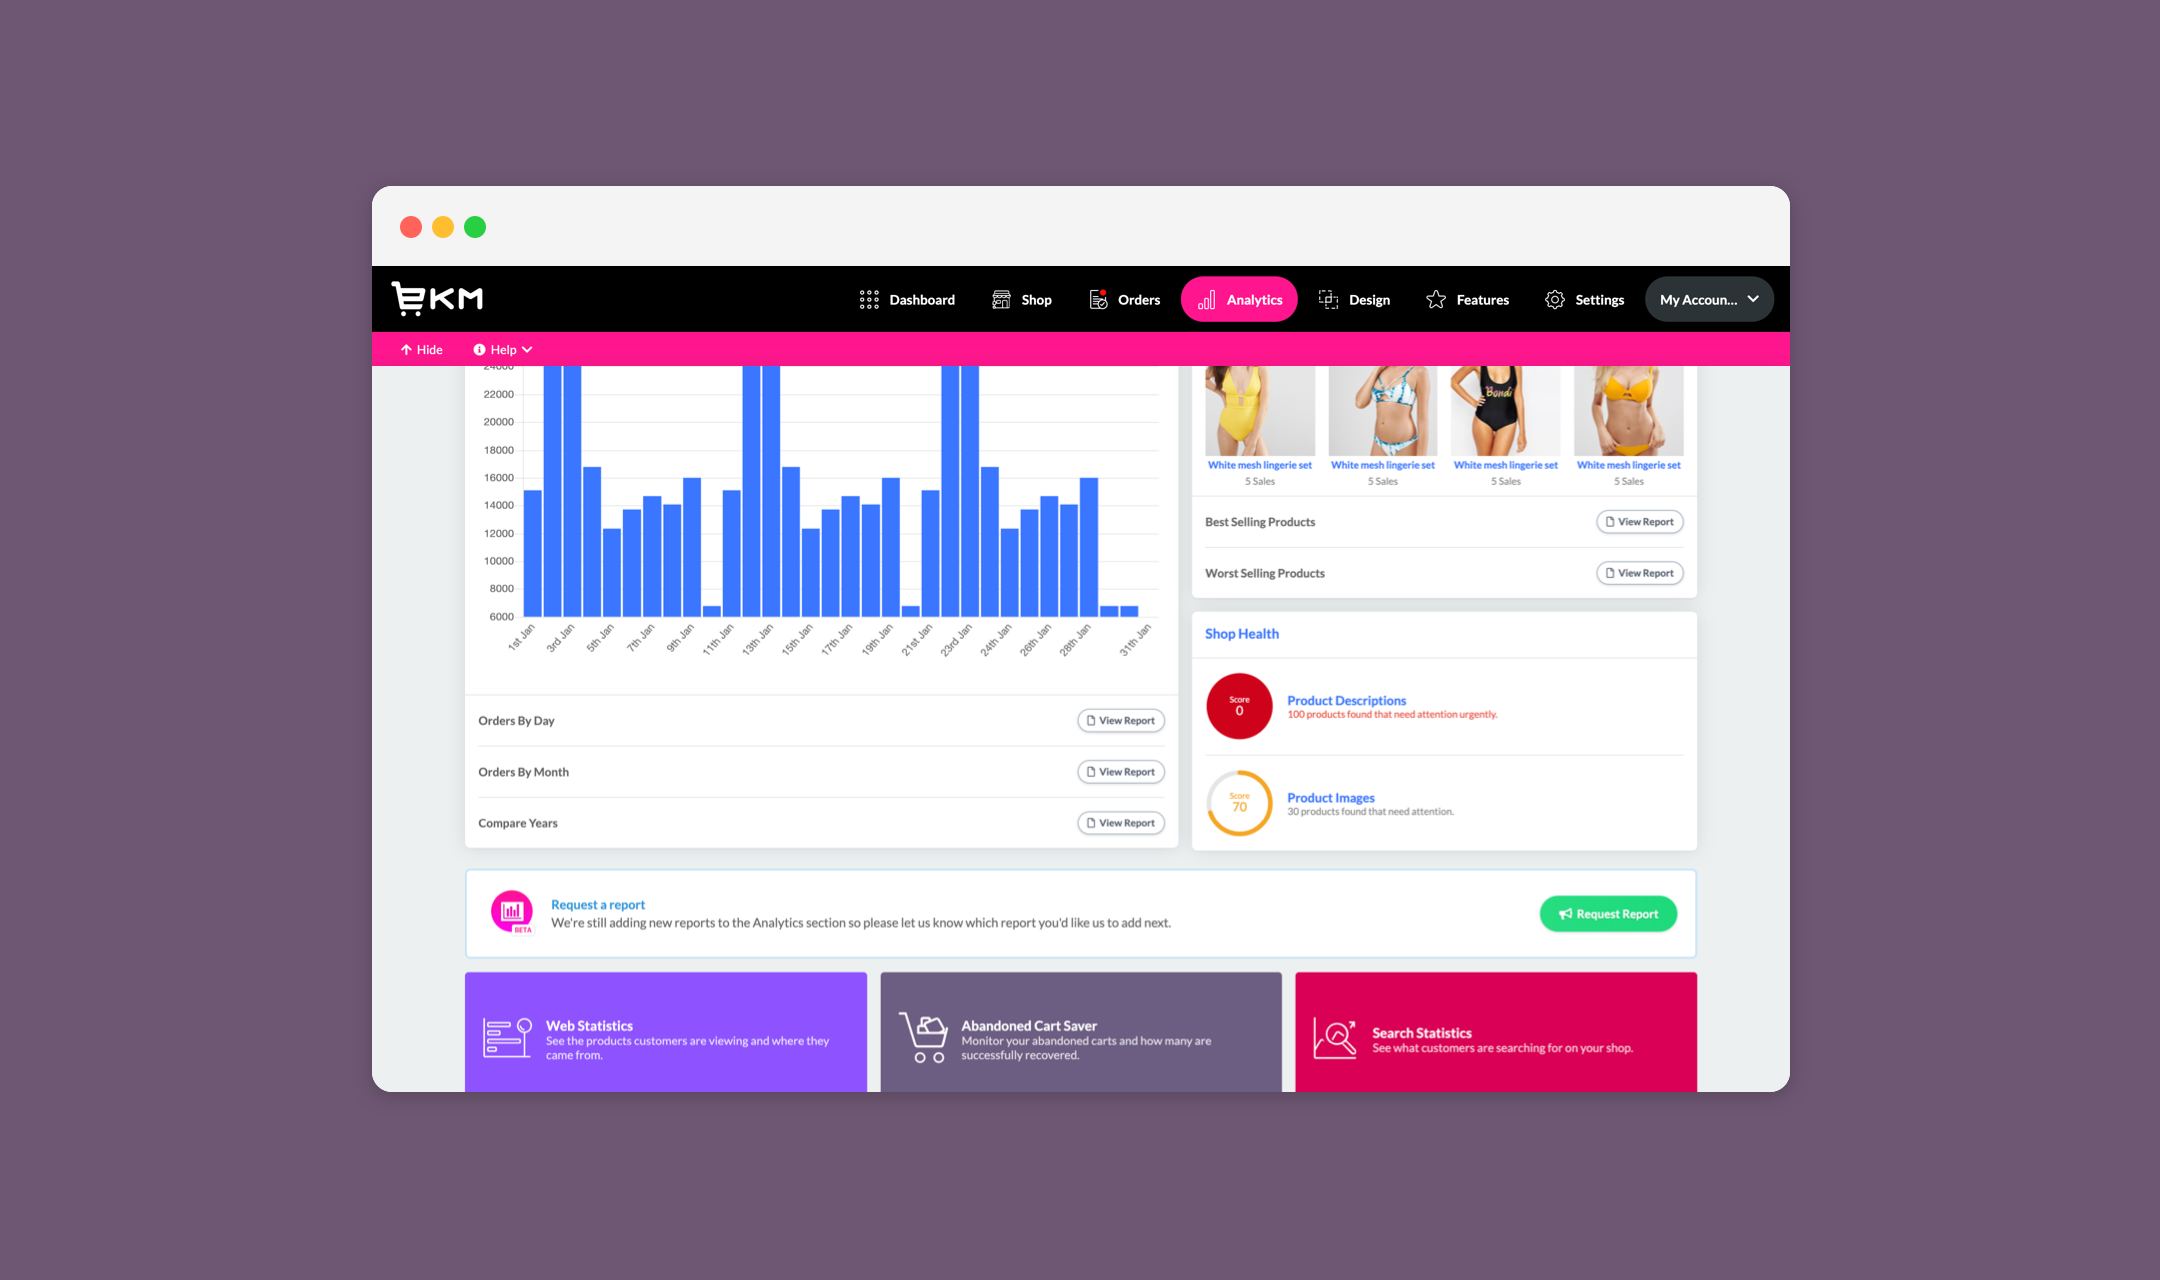
We were tasked with building some new reports around this:
- Products with poor images
- Products without adequate descriptions
These are areas where customers often struggle and the system offered no easy way to discover poorly formatted products.
Leaving beta
Analytics left beta in 2018 and some reports were made accessible to only certain plans (we had Basic, Advanced and Established). This was a business requirement designed to encourage customers to upgrade to a more expensive plan.
We made changes to accommodate this:
- Feature blocking: Teasing reports on higher plans but requiring an upgrade to access.
- Making reports only accessible on certain plans.
- Advertising reports on other plans.
Basic Plan
- Shop Health reports
Advanced & Established Plan
- Orders by day
- Orders by month
- Compare years
- Best selling products
- Worst selling products
Future releases
In mid-2018 my squad was moved to working on other new features and Analytics developments mostly tailed off.
We still monitored user feedback until the feedback collection form was removed and actioned smaller improvements where we could fit them into our sprint. We released various new reports:
- Orders by device (desktop, mobile and tablet)
- Most valuable customers
From mid-2018 to early-2019 most of the Shop Management Squad left the company (myself included) and the Analytics feature has largely remained the same since.
Lessons learned
The primary lesson I learned while working on Analytics was that even with the best intentioned competitor research your users are unique to you – and they may not have the same requirements as customers for competitors.
We found that EKM users were not asking for the flashy reports with “circles on people’s houses” and custom tax reports. Instead we found customers who simply wanted more insight into their orders and performance and access to actionable information to improve their business. And we delivered that.
Analytics is one of the projects I’m most proud of – simply because we built what the user needed to do business.